- Home
- News
- Features
- Topics
- Labor
- Management
- Opinions/Blogs
- Tools & Resources

Unions Improve Wages And Benefits For All Workers, Not Just Union Members
Unions improve wages and benefits for all workers, not just union members. They help reduce income inequality by making sure all Americans, and not just the wealthy elite, share in the benefits of their labor.
Unions also reduce racial disparities in wages and raise women’s wages, helping to counteract disparate labor market outcomes by race and gender that result from occupational segregation, discrimination, and other labor market inequities related to structural racism and sexism.
Unions lower inequality
Finally, unions help win progressive policies at the federal, state, and local levels that benefit all workers. And conversely, where unions are weak, wealthy corporations and their allies are more successful at pushing through policies and legislation that hurt working people. A strong labor movement protects workers, reduces disparities, and strengthens our democracy.
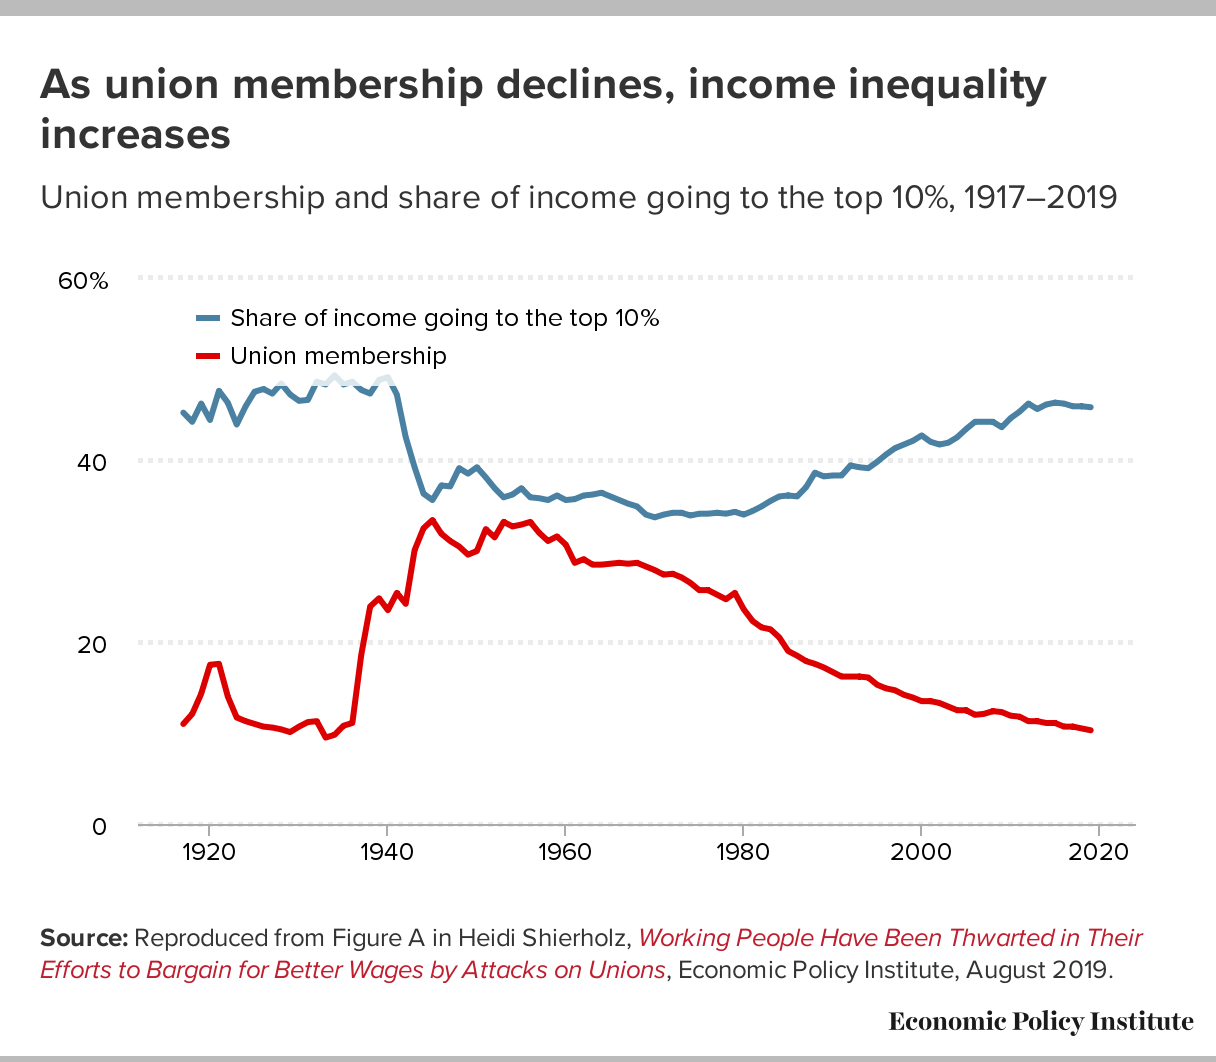
By bringing workers’ collective power to the bargaining table, unions are able to win better wages and benefits for working people—reducing income inequality as a result. As seen in Figure A, there was less income inequality in the decades following World War II than there is today. Not coincidentally, union membership was at its highest rate in 1945, just as the war was ending. But as union strength steadily declined—particularly after 1979—income inequality got worse, and it is now at its worst point since the Great Depression.Figure A
As union membership declines, income inequality increases Union membership and share of income going to the top 10%, 1917–2019
| Year | Union membership | Share of income going to the top 10% |
|---|---|---|
| 1917 | 11.0% | 45.2% |
| 1918 | 12.1% | 44.2% |
| 1919 | 14.3% | 46.2% |
| 1920 | 17.5% | 44.4% |
| 1921 | 17.6% | 47.6% |
| 1922 | 14.0% | 46.3% |
| 1923 | 11.7% | 43.9% |
| 1924 | 11.3% | 45.9% |
| 1925 | 11.0% | 47.5% |
| 1926 | 10.7% | 47.8% |
| 1927 | 10.6% | 47.3% |
| 1928 | 10.4% | 48.4% |
| 1929 | 10.1% | 47.2% |
| 1930 | 10.7% | 46.5% |
| 1931 | 11.2% | 46.6% |
| 1932 | 11.3% | 48.6% |
| 1933 | 9.5% | 48.3% |
| 1934 | 9.8% | 49.3% |
| 1935 | 10.8% | 48.3% |
| 1936 | 11.1% | 48.6% |
| 1937 | 18.6% | 47.7% |
| 1938 | 23.9% | 47.3% |
| 1939 | 24.8% | 48.8% |
| 1940 | 23.5% | 49.1% |
| 1941 | 25.4% | 47.2% |
| 1942 | 24.2% | 42.5% |
| 1943 | 30.1% | 39.2% |
| 1944 | 32.5% | 36.3% |
| 1945 | 33.4% | 35.6% |
| 1946 | 31.9% | 37.2% |
| 1947 | 31.1% | 37.1% |
| 1948 | 30.5% | 39.1% |
| 1949 | 29.6% | 38.5% |
| 1950 | 30.0% | 39.2% |
| 1951 | 32.4% | 38.1% |
| 1952 | 31.5% | 36.9% |
| 1953 | 33.2% | 35.9% |
| 1954 | 32.7% | 36.2% |
| 1955 | 32.9% | 36.9% |
| 1956 | 33.2% | 35.9% |
| 1957 | 32.0% | 35.8% |
| 1958 | 31.1% | 35.6% |
| 1959 | 31.6% | 36.1% |
| 1960 | 30.7% | 35.6% |
| 1961 | 28.7% | 35.7% |
| 1962 | 29.1% | 36.1% |
| 1963 | 28.5% | 36.2% |
| 1964 | 28.5% | 36.4% |
| 1965 | 28.6% | 36.0% |
| 1966 | 28.7% | 35.6% |
| 1967 | 28.6% | 35.2% |
| 1968 | 28.7% | 34.9% |
| 1969 | 28.3% | 34.0% |
| 1970 | 27.9% | 33.7% |
| 1971 | 27.4% | 34.0% |
| 1972 | 27.5% | 34.2% |
| 1973 | 27.1% | 34.2% |
| 1974 | 26.5% | 33.9% |
| 1975 | 25.7% | 34.1% |
| 1976 | 25.7% | 34.1% |
| 1977 | 25.2% | 34.2% |
| 1978 | 24.7% | 34.1% |
| 1979 | 25.4% | 34.3% |
| 1980 | 23.6% | 34.0% |
| 1981 | 22.3% | 34.4% |
| 1982 | 21.6% | 34.9% |
| 1983 | 21.4% | 35.5% |
| 1984 | 20.5% | 36.0% |
| 1985 | 19.0% | 36.1% |
| 1986 | 18.5% | 36.0% |
| 1987 | 17.9% | 37.0% |
| 1988 | 17.6% | 38.6% |
| 1989 | 17.2% | 38.2% |
| 1990 | 16.7% | 38.3% |
| 1991 | 16.2% | 38.3% |
| 1992 | 16.2% | 39.4% |
| 1993 | 16.2% | 39.2% |
| 1994 | 16.1% | 39.1% |
| 1995 | 15.3% | 39.8% |
| 1996 | 14.9% | 40.6% |
| 1997 | 14.7% | 41.3% |
| 1998 | 14.2% | 41.7% |
| 1999 | 13.9% | 42.1% |
| 2000 | 13.5% | 42.7% |
| 2001 | 13.5% | 42.0% |
| 2002 | 13.3% | 41.7% |
| 2003 | 12.9% | 41.9% |
| 2004 | 12.5% | 42.5% |
| 2005 | 12.5% | 43.4% |
| 2006 | 12.0% | 44.2% |
| 2007 | 12.1% | 44.2% |
| 2008 | 12.4% | 44.2% |
| 2009 | 12.3% | 43.6% |
| 2010 | 11.9% | 44.6% |
| 2011 | 11.8% | 45.3% |
| 2012 | 11.3% | 46.2% |
| 2013 | 11.3% | 45.6% |
| 2014 | 11.1% | 46.1% |
| 2015 | 11.1% | 46.3% |
| 2016 | 10.7% | 46.2% |
| 2017 | 10.7% | 45.9% |
| 2018 | 10.5% | 45.9% |
| 2019 | 10.3% | 45.8% |
Share of income going to the top 10%Union membership20001925195019750102030405060%ChartData
Source: Reproduced from Figure A in Heidi Shierholz, Working People Have Been Thwarted in Their Efforts to Bargain for Better Wages by Attacks on Unions, Economic Policy Institute, August 2019. Share Tweet Embed Download image
Deunionization depressed the wages of middle-wage earners but had little impact on high-wage earners and therefore greatly increased wage inequality between these two groups. For instance, deunionization explains a third of the growth of the wage gap between high- and middle-wage earners over the 1979–2017 period.1
The erosion of collective bargaining is the second largest factor that suppressed wage growth and fueled wage inequality over the last four decades—only excessive unemployment had a larger impact.2
When unions are strong, they set wage standards for entire industries and occupations; they make wages more equal within occupations; and they close pay gaps between white workers and workers of color. The reasons unions are such a major force for equality are set out more fully below.
Unions raise wages for both union and nonunion workers
While union workers receive higher wages than nonunion workers, nonunion workers also benefit immensely from the presence of unions. This raises wages for working people and reduces wage inequality. We explain below.
Union workers earn more than nonunion workers. On average, a worker covered by a union contract earns 10.2% more in hourly wages than someone with similar education, occupation, and experience in a nonunionized workplace in the same sector.3
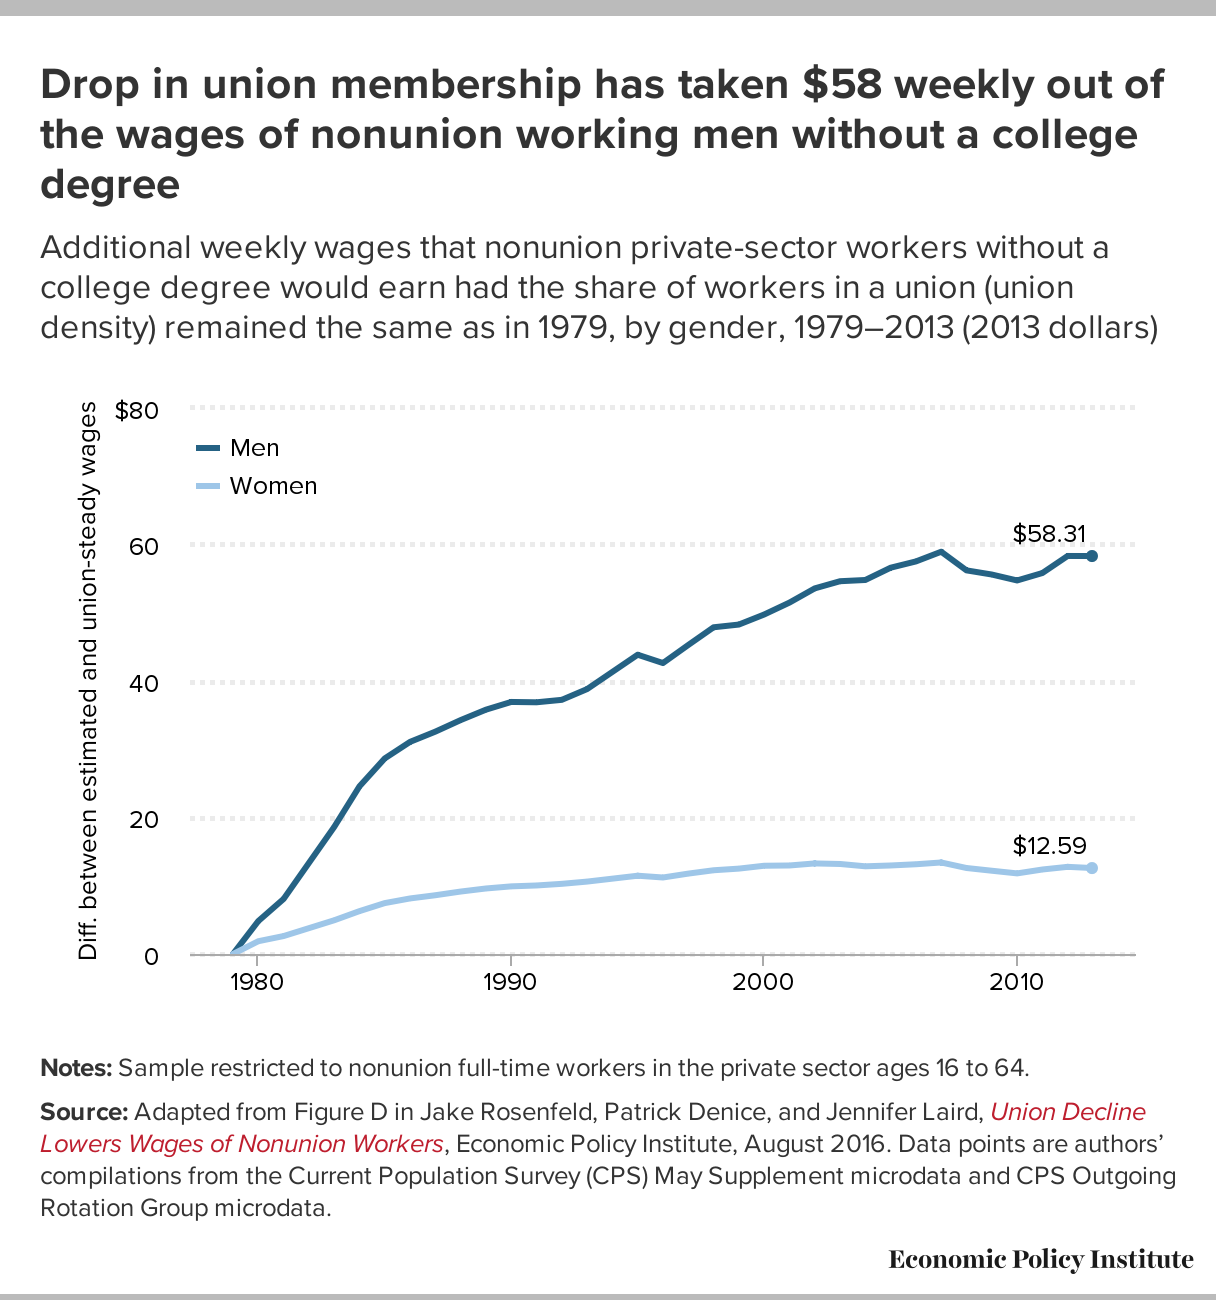
When union density is high, nonunion workers benefit from higher wages. When the share of workers who are union members in an industry or occupation is relatively high, as it was in 1979, wages of nonunion workers are higher than they would otherwise be. For example, had union density remained at its 1979 level, weekly wages of nonunion men in the private sector would be 5% higher (that’s an additional $2,704 in earnings for year-round workers), while weekly wages for nonunion men in the private sector without a college education would be 8%, or $3,016 per year, higher.4 Figure B shows how much more nonunion workers would earn had union density remained the same, by gender. Figure C shows the numbers for nonunion workers without a college degree.Figure B
Drop in union membership has taken $52 weekly out of nonunion working men’s wagesAdditional weekly wages that nonunion private-sector workers would earn had the share of workers in a union (union density) remained the same as in 1979, by gender, 1979–2013 (2013 dollars)
| Year | Men | Women |
|---|---|---|
| 1979 | 0.00 | 0.00 |
| 1980 | 4.55 | 1.81 |
| 1981 | 7.34 | 2.50 |
| 1983 | 16.93 | 4.77 |
| 1984 | 22.11 | 6.18 |
| 1985 | 25.90 | 7.39 |
| 1986 | 28.29 | 8.14 |
| 1987 | 29.63 | 8.60 |
| 1988 | 31.24 | 9.19 |
| 1989 | 32.36 | 9.76 |
| 1990 | 33.57 | 10.07 |
| 1991 | 33.57 | 10.27 |
| 1992 | 33.58 | 10.57 |
| 1993 | 34.83 | 10.89 |
| 1995 | 38.96 | 11.74 |
| 1996 | 38.38 | 11.62 |
| 1997 | 40.31 | 12.33 |
| 1998 | 42.69 | 12.74 |
| 1999 | 43.50 | 12.84 |
| 2000 | 45.00 | 13.41 |
| 2001 | 46.29 | 13.48 |
| 2002 | 48.02 | 13.76 |
| 2003 | 49.62 | 13.91 |
| 2004 | 49.55 | 13.63 |
| 2005 | 50.49 | 13.89 |
| 2006 | 51.14 | 13.86 |
| 2007 | 51.98 | 14.09 |
| 2008 | 50.01 | 13.48 |
| 2009 | 50.07 | 12.87 |
| 2010 | 49.09 | 12.63 |
| 2011 | 50.08 | 13.48 |
| 2012 | 52.48 | 13.80 |
| 2013 | $52.39 | $13.80 |
Diff. between estimated and union-steady wages$52.39$13.80MenWomen02040$60-201980199020002010ChartData
Notes: Sample restricted to nonunion full-time workers in the private sector ages 16 to 64.
Source: Adapted from Figure C in Jake Rosenfeld, Patrick Denice and Jennifer Laird, Union Decline Lowers Wages of Nonunion Workers, Economic Policy Institute, August 2016. Data points are authors’ compilations from the Current Population Survey (CPS) May Supplement microdata and CPS Outgoing Rotation Group microdata. Share Tweet Embed Download imageFigure C
Drop in union membership has taken $58 weekly out of the wages of nonunion working men without a college degree Additional weekly wages that nonunion private-sector workers without a college degree would earn had the share of workers in a union (union density) remained the same as in 1979, by gender, 1979–2013 (2013 dollars)
| Year | Men | Women |
|---|---|---|
| 1979 | 0.00 | 0.00 |
| 1980 | 4.82 | 1.87 |
| 1981 | 8.07 | 2.63 |
| 1983 | 18.61 | 4.94 |
| 1984 | 24.56 | 6.28 |
| 1985 | 28.66 | 7.46 |
| 1986 | 31.08 | 8.14 |
| 1987 | 32.58 | 8.61 |
| 1988 | 34.27 | 9.15 |
| 1989 | 35.80 | 9.60 |
| 1990 | 36.93 | 9.91 |
| 1991 | 36.88 | 10.04 |
| 1992 | 37.24 | 10.28 |
| 1993 | 38.82 | 10.61 |
| 1995 | 43.85 | 11.47 |
| 1996 | 42.63 | 11.21 |
| 1997 | 45.28 | 11.78 |
| 1998 | 47.87 | 12.27 |
| 1999 | 48.27 | 12.51 |
| 2000 | 49.74 | 12.93 |
| 2001 | 51.49 | 12.97 |
| 2002 | 53.57 | 13.27 |
| 2003 | 54.62 | 13.19 |
| 2004 | 54.80 | 12.85 |
| 2005 | 56.60 | 12.97 |
| 2006 | 57.52 | 13.15 |
| 2007 | 58.94 | 13.41 |
| 2008 | 56.21 | 12.60 |
| 2009 | 55.60 | 12.20 |
| 2010 | 54.73 | 11.81 |
| 2011 | 55.82 | 12.38 |
| 2012 | 58.32 | 12.77 |
| 2013 | $58.31 | $12.59 |
Diff. between estimated and union-steady wages$58.31$12.59MenWomen-200204060$801980199020002010ChartData
Notes: Sample restricted to nonunion full-time workers in the private sector ages 16 to 64.
Source: Adapted from Figure D in Jake Rosenfeld, Patrick Denice, and Jennifer Laird, Union Decline Lowers Wages of Nonunion Workers, Economic Policy Institute, August 2016. Data points are authors’ compilations from the Current Population Survey (CPS) May Supplement microdata and CPS Outgoing Rotation Group microdata. Share Tweet Embed Download image
In states where unions are strong, wages are higher for workers—union and nonunion alike. Wages are lower in states with low union density compared with states with high union density—$1,121.70 a week versus $942.70 a week in 2020.5
Unions bring living wages to low-wage jobs. Unions have transformed once-low-wage jobs in hospitality, nursing, and janitorial services into positions with living wages and opportunities for advancement. For example, after unionizing, dishwashers in Las Vegas hotels made $4 per hour more than the national average for that job, and they were offered excellent benefits. In Houston, a 2006 first-ever union contract for 5,300 janitors resulted in a 47% pay increase and an increase in guaranteed weekly hours of work.6
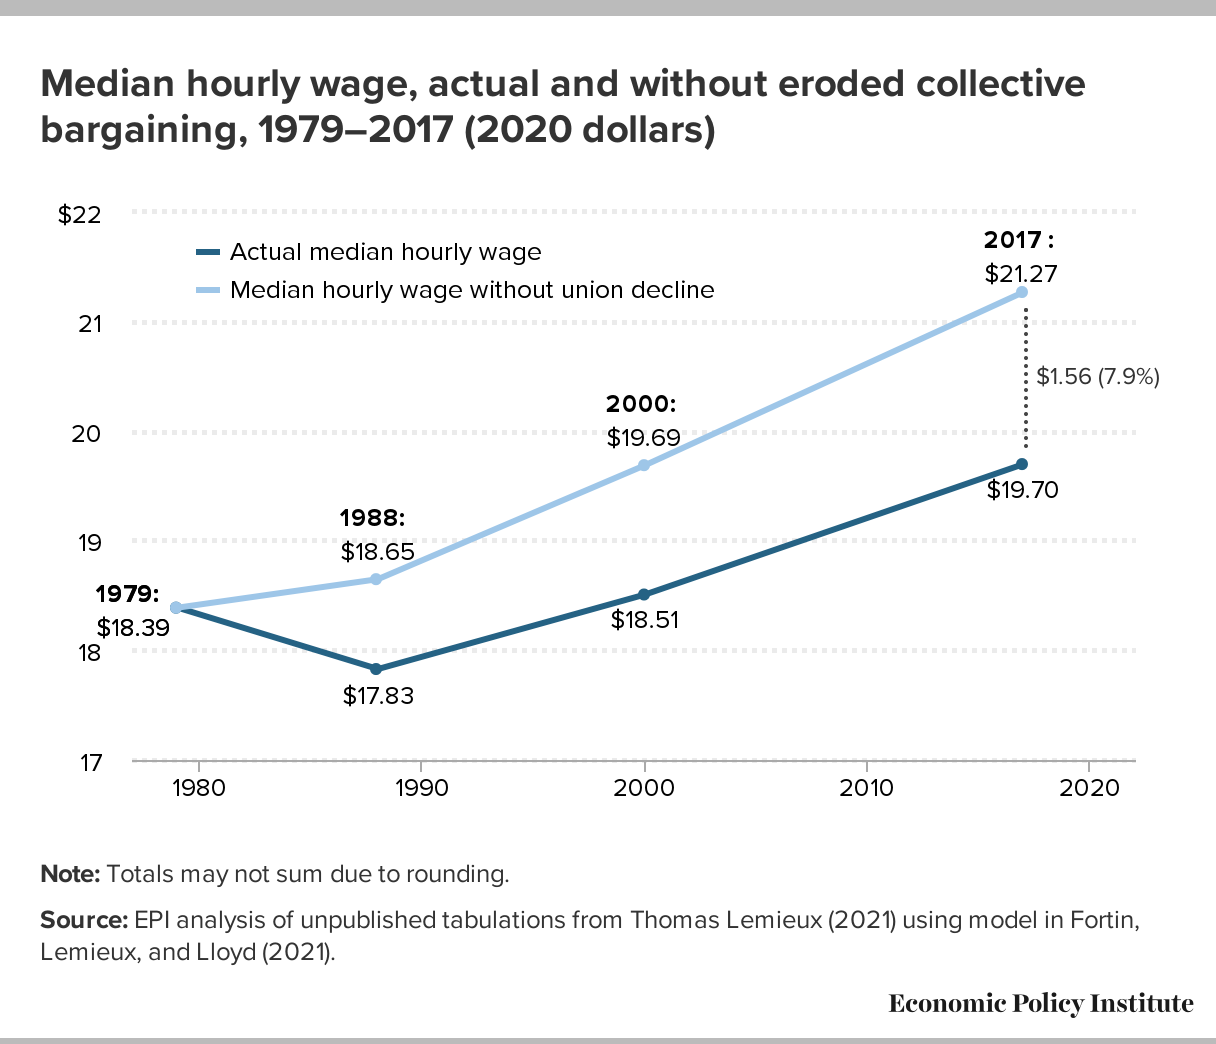
If unionization hadn’t eroded, wages for the middle class would be much higher. Recent research examining the direct effect on wages of union workers and the spillover effect on wages of nonunion workers has demonstrated that the median worker’s wages would have been much higher, and inequality between middle- and high-wage workers much lower, had there not been an erosion of collective bargaining. For instance, the “typical” or median worker would have earned $1.56 more, a 7.9% increase (0.2% annually), in 2017 had unionization not declined since 1979 (Figure D). This translates to an equivalent gain of $3,250 for a full-time, full-year worker.7Figure D
Median hourly wage, actual and without eroded collective bargaining, 1979–2017 (2020 dollars)
| Actual median hourly wage | Median hourly wage without union decline | |
|---|---|---|
| 1979 | $18.39 | 18.39 |
| 1988 | 17.83 | 18.65 |
| 2000 | 18.51 | 19.69 |
| 2017 | 19.70 | 21.27 |
| 2020 |
1979:$18.39$17.83$18.51$19.701979:$18.391988:$18.652000:$19.692017 :$21.27Actual median hourly wageMedian hourly wage without union decline1718192021$22$1.56 (7.9%)ChartData
Note: Totals may not sum due to rounding.
Source: EPI analysis of unpublished tabulations from Thomas Lemieux (2021) using model in Fortin, Lemieux, and Lloyd (2021). Share Tweet Embed Download image
Unions help raise wages for women and reduce racial economic disparities
Unions have played an essential role in narrowing gender and racial/ethnic pay gaps. Here’s how.
Unions help raise women’s pay. Hourly wages for women represented by unions are 4.7% higher on average than for nonunionized women with comparable characteristics.8
Unions raise wages in the female-dominated service occupations. Union-represented workers in service occupations (which include food service and janitorial services) make 52.1% more in wages than their nonunion counterparts. These occupations are disproportionately held by women.9
Unions help reduce racial economic disparities. Black and Hispanic workers get a larger boost from unionization than their white counterparts. Black workers—both men and women—are more likely than white workers to be covered by collective bargaining, and the wage boost they get from being covered by collective bargaining is 13.1%, above the 10.2% average wage boost for unionized workers overall.
The result of this union wage premium—how much more union workers earn than comparable nonunion workers—is that collective bargaining lifts wages of Black workers closer to those of their white counterparts. Hispanic workers have slightly lower union coverage than white workers but have a much higher union wage advantage (an 18.8% boost in pay) and thus wage gaps between Hispanic workers and their white counterparts are also smaller because of collective bargaining.10
The phenomenon that unions narrow the Black–white wage gap isn’t new. Starting in the mid-1940s, Black workers began to be more likely to be in unions and to have a larger union premium than white workers.11 This means that the decline of unionization has played a significant role in the expansion of the Black–white wage gap in recent decades and that increasing unionization is a crucial step in reversing those trends.12
Unions support strong families with better benefits and job protections
Union workers are more likely to be covered by employer-provided health insurance. More than nine in 10 workers—95%—covered by a union contract have access to employer-sponsored health benefits, compared with just 68% of nonunion workers. When adjustments are made for other characteristics that may affect benefits coverage—such as sector (public or private), industry, region, employee status (full- or part-time), and establishment size—union workers are 18.3% more likely to be covered.13
Union employers contribute more to workers’ health care benefits. Union employers providing health insurance pay 77.4% more (per hour worked) toward their employees’ health coverage (providing better benefits for a greater share of workers) than comparable nonunion employers. Occupations with higher-than-average union impact on employer-provided health care include transportation, services, construction, extraction, and installation/maintenance/repair.14
Union workers have greater access to paid sick days. More than nine in 10 workers—93%—covered by a union contract have access to paid sick days, compared with 75% of nonunion workers. Almost all union workers—98%—in state and local government have paid sick days, compared with 86% of their nonunion peers. In the private sector, 88% of union workers have paid sick days, compared with 74% of their nonunion peers.15
Union workers are more likely to have paid vacation and holidays. In the private sector, 91% of workers covered by a union contract get paid vacation and paid holidays, whereas 78% of nonunion workers get paid vacation and 79% get paid holidays. For workers overall (in both the private and public sectors), 81% of union workers get paid holidays, while 78% of nonunion workers do.16
Employers contribute more to paid vacation and holidays for union workers than for nonunion workers. Union employers contribute 11.4% more toward paid vacation and holidays for their workers than do comparable nonunion employers. Industries and occupations with higher-than-average employer contributions toward paid vacation and holidays include production, transportation, office and administrative support, service occupations, and construction.17
Unions provide due process, protecting workers from arbitrary dismissal. Private employment in every state except for Montana is generally “at will,” meaning employers are free to dismiss workers for almost any reason, except for reasons specified by law (e.g., on account of race, religion, disability, or other identities that are protected classes). Union contracts typically have provisions that require employers to have a proper, documented, performance-related reason for disciplining or dismissing a worker (“just cause”) and generally the worker has a chance to improve performance before the employer moves to dismiss the worker. Collective bargaining agreements also typically include a grievance and arbitration process to allow workers and the union to challenge unfair discipline or terminations.
Union workers have more input into the number of hours they work. Almost half (46%) of nonunion workers say they have little or no input into the number of hours they work each week, compared with less than a quarter (22%) of union workers.18
Union workers get more advance notice of their work schedules. More than one in three workers (34.4%) who belong to a union get at least a week’s advance notice of their work schedules, whereas less than one in four nonunion workers (23.2%) do. (These calculations exclude workers whose schedules never change.)19
Unions are good for workers’ retirement security
Ninety-four percent of union workers participate in a retirement plan (of any kind), compared with 67% of nonunion workers.20 Union employers (when adjustments are made for various employer characteristics) are 22.5% more likely to offer an employer-provided retirement plan and, on average, to spend 27.7% more on retirement plans than do comparable nonunion employers.21
Unions boost civic participation
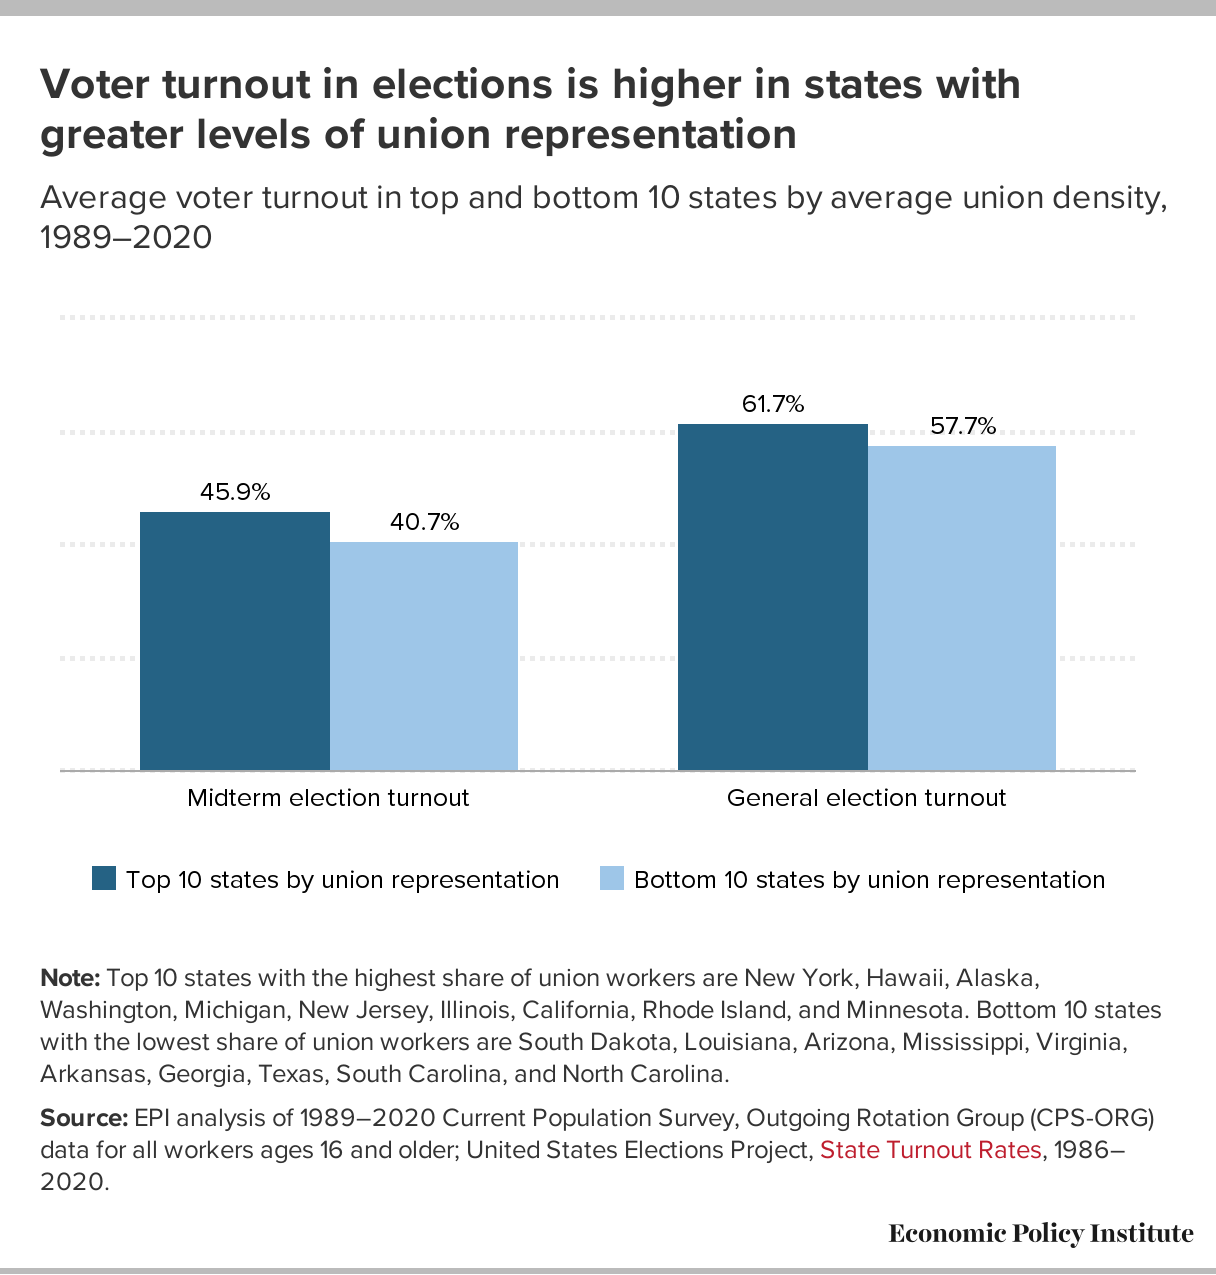
Unions communicate with their members about issues and candidates to make sure workers have information when they go to the polls on Election Day. Union members’ voter turnout is significantly higher than the general public’s. A study of union members finds they are 12 percentage points more likely to vote than voters who are not in a union.22 Other research shows that voter turnout is higher in states with greater levels of unionization (Figure E).Figure E
Voter turnout in elections is higher in states with greater levels of union representationAverage voter turnout in top and bottom 10 states by average union density, 1989–2020
| Top 10 states by union representation | Bottom 10 states by union representation | |
|---|---|---|
| Midterm election turnout | 45.9% | 40.7% |
| General election turnout | 61.7% | 57.7% |
45.9%61.7%40.7%57.7%Top 10 states by union representation Bottom 10 states by union representationMidterm election turnoutGeneral election turnoutChartData
Note: Top 10 states with the highest share of union workers are New York, Hawaii, Alaska, Washington, Michigan, New Jersey, Illinois, California, Rhode Island, and Minnesota. Bottom 10 states with the lowest share of union workers are South Dakota, Louisiana, Arizona, Mississippi, Virginia, Arkansas, Georgia, Texas, South Carolina, and North Carolina.
Source: EPI analysis of 1989–2020 Current Population Survey, Outgoing Rotation Group (CPS-ORG) data for all workers ages 16 and older; United States Elections Project, State Turnout Rates, 1986–2020. Share Tweet Embed Download image
Conversely, turnout is lower in states that have adopted anti-worker “right-to-work” legislation. Right-to-work laws undermine unions’ ability to collect “fair share fees” from workers whose interests they represent. Fair share fees cover the costs of bargaining, contract administration, and grievance processes that unions are required by law to undertake on behalf of all (union and nonunion) members of a collective bargaining unit. Without fair share fees, union power degrades quickly—which is exactly what anti-union employers want.
According to research by Columbia University professor Alex Hertel-Fernandez and his colleagues, the passage of right-to-work laws reduced voter turnout by 2% in presidential elections. This is not insignificant considering that in right-to-work states Michigan and Wisconsin, the losing candidate lost by less than 1 percentage point in the 2016 election.23
Moreover, according to these authors, the state policy agenda becomes more anti-worker in states that adopt right-to-work laws. Right-to-work states are less likely to have minimum wages above the federal minimum wage, more likely to preempt local (city or county) minimum wages, and less likely to have prevailing wage laws.
Unions are key supporters of progressive policies that help all workers
Unions have been a key part of efforts to pass laws that provide economic security, strong communities, and dignity on the job for all workers. The labor movement helped pass and defend the Occupational Safety and Health Act, the Civil Rights Act, the Social Security Act, Medicare and Medicaid, and numerous other laws benefiting all workers and their communities.
Consider the following:
- State minimum wages are lower in states with low union density.
- The states that have passed legislation to raise their minimum wage to $15 per hour (including California, Massachusetts, New Jersey, and New York) are among the states with the highest union density and the strongest labor movements.
- Cities and states that have adopted paid sick days laws, fair scheduling laws,24 and other progressive legislation have strong labor movements.
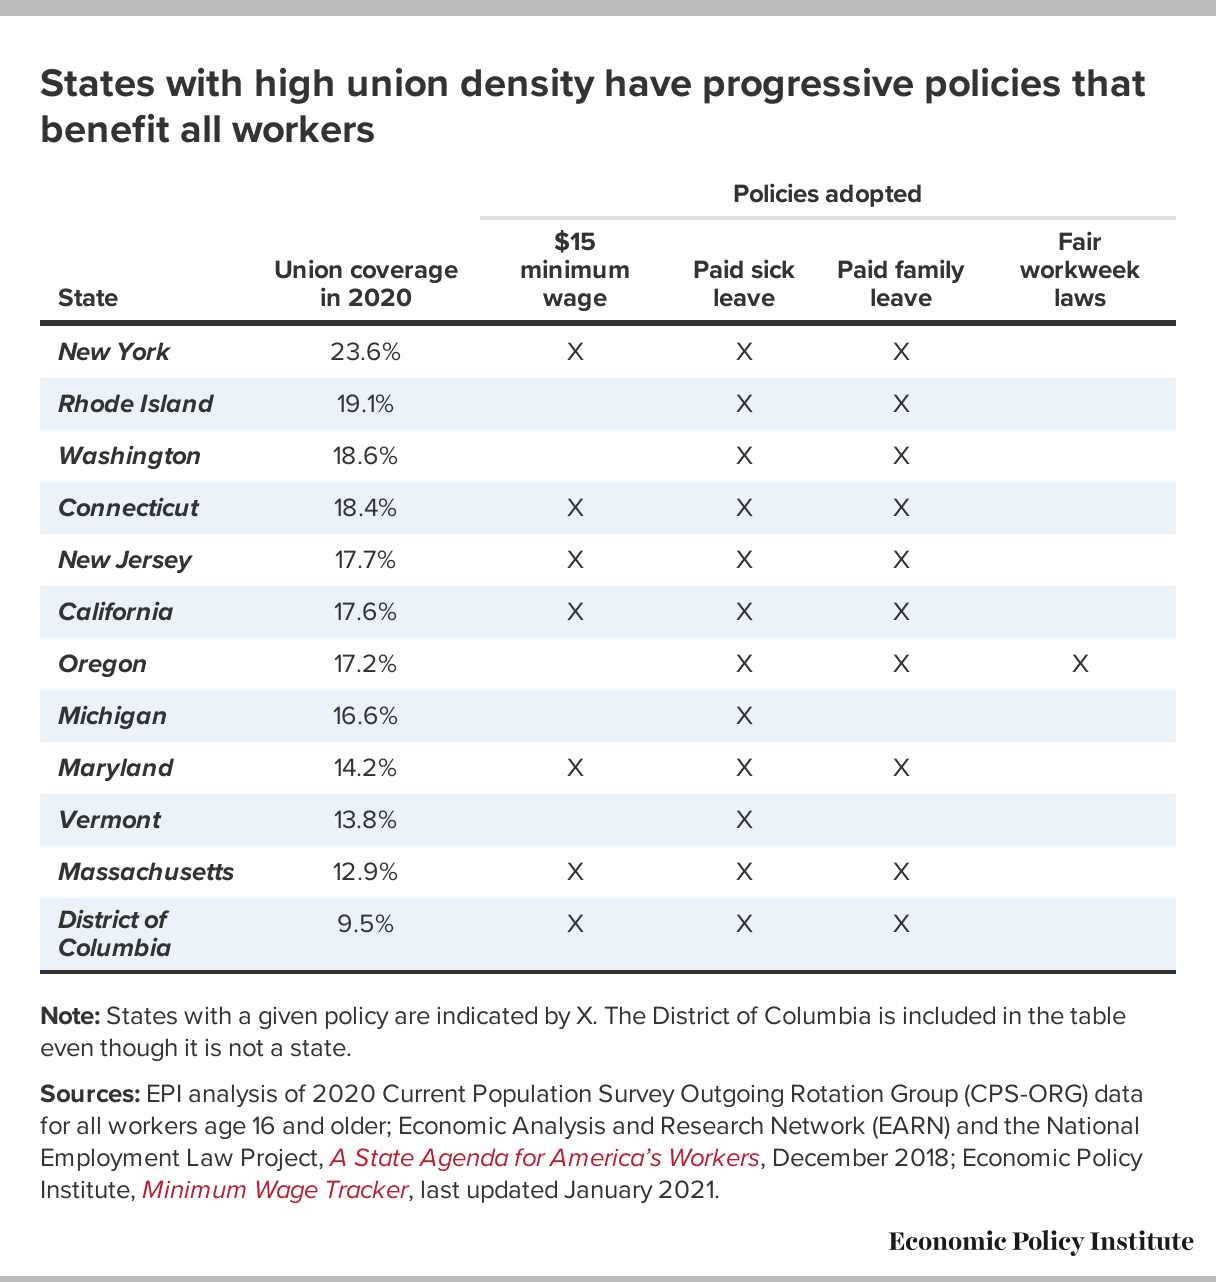
Table 1 shows the progressive policies that exist in states with high union density.Table 1
States with high union density have progressive policies that benefit all workers
| Policies adopted | |||||
|---|---|---|---|---|---|
| State | Union coverage in 2020 | $15 minimum wage | Paid sick leave | Paid family leave | Fair workweek laws |
| New York | 23.6% | X | X | X | |
| Rhode Island | 19.1% | X | X | ||
| Washington | 18.6% | X | X | ||
| Connecticut | 18.4% | X | X | X | |
| New Jersey | 17.7% | X | X | X | |
| California | 17.6% | X | X | X | |
| Oregon | 17.2% | X | X | X | |
| Michigan | 16.6% | X | |||
| Maryland | 14.2% | X | X | X | |
| Vermont | 13.8% | X | |||
| Massachusetts | 12.9% | X | X | X | |
| District of Columbia | 9.5% | X | X | X |
Note: States with a given policy are indicated by X. The District of Columbia is included in the table even though it is not a state.
Sources: EPI analysis of 2020 Current Population Survey Outgoing Rotation Group (CPS-ORG) data for all workers age 16 and older; Economic Analysis and Research Network (EARN) and the National Employment Law Project, A State Agenda for America’s Workers, December 2018; Economic Policy Institute, Minimum Wage Tracker, last updated January 2021. Share Tweet Embed Download image
Notes
1. Lawrence Mishel, The Enormous Impact of Eroded Collective Bargaining on Wages, Economic Policy Institute, April 8, 2021.
2. Lawrence Mishel and Josh Bivens, Identifying the Policy Levers Generating Wage Suppression and Wage Inequality [working title]. Economic Policy Institute, forthcoming May 2021.
3. “Union Wage Premium by Demographic Group, 2011,” Table 4.33 in Lawrence Mishel et al., The State of Working America, 12th Edition, an Economic Policy Institute book (Ithaca, N.Y.: Cornell Univ. Press, 2012), updated with 2020 microdata from the Current Population Survey Outgoing Rotation Group (CPS-ORG).
4. These estimates look at what wages would have been in 2013 had union density remained at its 1979 levels. Union density is the share of workers in similar industries and regions who are union members. For the typical nonunion man working year-round in the private sector, the decline in private-sector union density since 1979 has led to an annual wage loss of $2,704 (2013 dollars). For the 40.2 million nonunion men working in the private sector, the total loss is equivalent to $109 billion annually. The effects of union decline on the wages of nonunion women are not as substantial because women were not as likely to be unionized as men were in 1979. See Jake Rosenfeld, Patrick Denice, and Jennifer Laird, Union Decline Lowers Wages of Nonunion Workers: The Overlooked Reason Why Wages Are Stuck and Inequality Is Growing, Economic Policy Institute, August 2016.
5. EPI analysis of Bureau of Labor Statistics Current Population Survey Outgoing Rotation Group (CPS-ORG) 2020 microdata. Wages are the average of the median weekly wage by state, for the top and bottom 10 states by union coverage.
6. Matt Vidal and David Kusnet, Organizing Prosperity: Union Effects on Job Quality, Community Betterment, and Industry Standards, Economic Policy Institute and UCLA Institute for Research on Labor and Employment, 2009; C. Jeffrey Waddoups, “Wages in Las Vegas and Reno: How Much Difference Do Unions Make in the Hotel, Gaming, and Recreation Industry?” UNLV Gaming Research & Review Journal 6, no. 1 (2001).
7. Lawrence Mishel, The Enormous Impact of Eroded Collective Bargaining on Wages, Economic Policy Institute, April 2021.
8. “Union Wage Premium by Demographic Group, 2011,” Table 4.33 in Mishel at al., The State of Working America, 12th Edition, an Economic Policy Institute book (Ithaca, N.Y.: Cornell Univ. Press, 2012), updated 2020 microdata from the Current Population Survey Outgoing Rotation Group (CPS-ORG) microdata.
9. Data are unadjusted for factors such as demographics and employer size. Data are as of March 2017 and are drawn from EPI analysis of Bureau of Labor Statistics, “Table 4. Median Weekly Earnings of Full-Time Wage and Salary Workers by Union Affiliation, Occupation, and Industry” (news release), last modified January 22, 2021. In 2020, women made up 57.0% of those employed in service occupations, but only 46.8% of all workers employed in 2020 (Bureau of Labor Statistics, “Household Data, Annual Averages, Employed Persons by Occupation, Sex, Age” [data table], data from the Current Population Survey). Service occupations include protective service, food preparation and serving, health care support, building and grounds cleaning and maintenance, and personal care and service.
10. EPI analysis of Bureau of Labor Statistics Current Population Survey Outgoing Rotation Group (CPS-ORG) 2020 microdata. The regression analysis producing this estimate controlled for education, experience, gender, race, citizenship status, geographic division, industry, and occupation.
11. Henry S. Farber, Daniel Herbst, Ilyana Kuziemko, and Suresh Naidu, “Unions and Inequality over the Twentieth Century: New Evidence from Survey Data,” National Bureau of Economic Research Working Paper no. 24587, published April 2021 in the Quarterly Journal of Economics, https://doi.org/10.1093/qje/qjab012.
12. Valerie Wilson and William M. Rodgers III, Black–White Wage Gaps Expand with Rising Wage Inequality, Economic Policy Institute, September 2016.
13. Bureau of Labor Statistics, Employee Benefits in the United States, “Table 2. Medical Care Benefits: Access, Participation, and Take-Up Rates, March 2020,” in Employee Benefits in the United States—March 2020, published September 24, 2020.
14. Data are as of March 2017 and come from Tables 2 and 6 in Bureau of Labor Statistics, “Employee Benefits in the United States—March 2017” (news release), U.S. Department of Labor, July 21, 2017.
15. Bureau of Labor Statistics, Employee Benefits in the United States, “Table 6. Selected Paid Leave Benefits: Access, March 2020,” in Employee Benefits in the United States—March 2020, published September 24, 2020.
16. Bureau of Labor Statistics, Employee Benefits in the United States, “Table 6. Selected Paid Leave Benefits: Access, March 2020,” In Employee Benefits in the United States—March 2020, published September 24, 2020.
17. Data are as of March 2017 and come from Tables 2 and 6 in Bureau of Labor Statistics, “Employee Benefits in the United States—March 2017” (news release], U.S. Department of Labor, July 21, 2017.
18. EPI analysis of the 2016 General Social Survey Quality of Worklife and Work Orientations supplements. “Union worker” here refers to workers who said they belonged to a union.
19. EPI analysis of the 2016 General Social Survey Quality of Worklife and Work Orientations supplements. Respondents were asked whether they or their spouses belong to a union.
20. Bureau of Labor Statistics, Employee Benefits in the United States, “Table 1. Retirement Benefits: Access, Participation, and Take-Up Rates, March 2020,” in Employee Benefits in the United States—March 2020, published September 24, 2020.
21. Adjusted data are based on analysis of fourth-quarter 1994 Employment Cost Index microdata as presented in Table 4.35 in Lawrence Mishel et al., The State of Working America, 12th Edition, an Economic Policy Institute book (Ithaca, N.Y.: Cornell Univ. Press, 2012), and drawn from Brooks Pierce, “Compensation Inequality,” U.S. Department of Labor Statistics Working Paper no. 323, 1999.
22. Sean McElwee, “One Big Reason for Voter Turnout Decline and Income Inequality: Smaller Unions,” American Prospect, January 30, 2015.
23. James Feigenbaum, Alexander Hertel-Fernandez, and Vanessa Williamson, “Right-to-Work Laws Have Devastated Unions—and Democrats,” New York Times, March 8, 2018.
24. Fair scheduling laws provide workers with greater stability, predictability, and flexibility in their work schedules.
List your business in the premium web directory for free This website is listed under Human Resources Directory
- Celebrating the Resilience of Low-Income Women

- CEOs Get to Retire Comfortably. Workers Like Me Deserve the Same.

- Jobs Increased 339,000 In May, Unemployment Up 0.3% To 3.7%

- The decline of job creation at new establishments

- Contractor faces 2 serious citations after US Department of Labor finds safety failures led to welder’s death at Bonner Bridge demolition project

- Investigation into worker’s severe arm injury finds Cusseta auto parts manufacturer, supplier willfully ignored safety precautions
- ‘It’s a sweat factory’: Instacart workers ready to strike for pay and conditions

- Ships backed up outside US ports pumping out pollutants as they idle

- Privacy fears as Moscow metro rolls out facial recognition pay system
- ‘We are not machines’: Hollywood workers poised to strike for better conditions
- Boeing pilot indicted for allegedly deceiving US regulators over 737 Max
- Ipswich apprentice butcher encourages others to consider industry

- Ipswich apprentice butcher encourages others to consider industry
- Over 10,000 John Deere workers strike over ‘years’ of poor treatment
- Corporations are pledging to be ‘water positive’. What does that mean?
- US Department of Labor investigation of crane collapse, double fatality on Interstate 10 finds Lufkin company failed to assemble crane properly
- For the 6th time in 7 years, federal inspectors find Illinois contractor putting construction workers at risk of industry’s deadliest hazard
- US Department of Labor proposes $83K in fines to healthcare facility for failing to protect workers from coronavirus hazards
- Facebook says it will do more to prevent online hate, harassment
- As U.S. prepares to reopen border, some urge Canada to relax testing requirement
- Biden orders companies to ease supply chain bottlenecks or he’ll ‘call them out’
- What is the ‘new model’ the EU is proposing for Northern Ireland?
- Apple to make 10 million fewer iPhones due to microchip shortage
- US Department of Labor, Mexican Consulate in Boston enter alliance to promote workplace safety, health among New England’s workers
- US Department of Labor sues Austin luxury car dealer that retaliated against employee who raised concerns of coronavirus hazards
- Vaccine hesitant New Yorkers consider leaving the city as mandates take effect
- Carbon emissions ‘will drop just 40% by 2050 with countries’ current pledges’
- House passes bill to raise US debt ceiling through early December
- ‘The stakes couldn’t be higher’: GE urged to invest in green US jobs
- Zellers returns — kind of — but the lowest price isn't quite the law
- Cement makers across world pledge large cut in emissions by 2030
- India faces electricity crisis as coal supplies run critically low
- California justice department to investigate enormous oil spill