- Home
- News
- Features
- Topics
- Labor
- Management
- Opinions/Blogs
- Tools & Resources
Study Finds 99% Of American Workers Get Decade Of Pain, Top 1% Net All The Income Gain
How well is the American economy providing acceptable growth in living standards and income for most households?
Economic Policy Institute’s The State of Working America, 12th Edition looks broadly at available data and concludes that the answer is simply “not well at all.”
This is not because the economy has failed to grow, on average.
Policy-driven wage inequality blocks growth for low- and middle-income Americans, giving nearly all of the economic gains during the past decade to those in the top 1% income bracket, the study shows.
National income has grown enough to substantially improve the fortunes for all. As the data reveal, however, it is the top 5%, the top 1%, and fractions of the top 1% that have received almost all the benefits of the economy’s growth.
America’s low- and middle-income families have suffered a lost decade.
- 22%
Despite an increase in productivity of more than 22% by 2010, typical wage earners made roughly the same amount per hour as in 2000.
- ↓ 6%
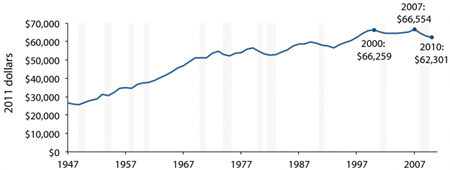
Median family income was 6% lower in 2010 than in 2000.
This lost decade of no wage and income growth began well before the Great Recession—which started in Dec. 2007—battered wages and incomes.
In the historically weak economic expansion following the 2001 recession, hourly wages and compensation failed to grow for either high school– or college-educated workers.

Real median family income, 1947–2010
Note: Data are for money income. Shaded areas denote recessions.
Source: Authors’ analysis of Current Population Survey Annual Social and Economic Supplement Historical Income Tables (Table F-5) Chart: The State of Working America. Washington, D.C.: Economic Policy Institute
Another lost decade ahead?
Consensus forecasts predict that unemployment will remain high for many more years, suggesting that typical Americans are in for another lost decade of living standards growth. For example, as a result of persistent high unemployment, the incomes of families in the middle fifth of the income distribution in 2018 will likely still be below 2000 levels.
A generation of rising social and income inequality.
- 156%
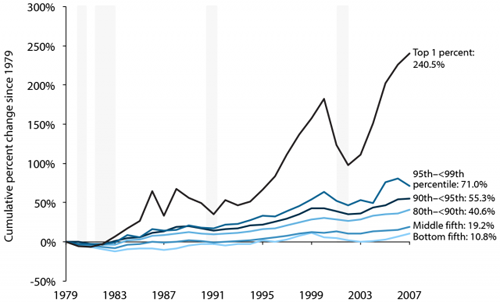
From 1979–2007, wages for the top 1% of wage earners grew 156%, compared to 17% for the bottom 90%.
- 60%
From 1979–2007, the top 1% of tax units claimed 60% of the cash, market-based income growth, compared to 9% for the bottom 90%.
- 38.3%
From 1983–2010, 38.3% of the wealth growth went to the top 1% and 74.2% to the top 5%. The bottom 60%, meanwhile, suffered a decline in wealth.
Rising inequality prevented wage growth for low- and middle-income workers.
- 0.6%

Change in real annual household income, by income group, 1979–2007
Note: Data are for comprehensive income. Shaded areas denote recessions.
Source: Authors’ analysis of data from the Congressional Budget Office (2010) ) Chart: The State of Working America. Washington, D.C.: Economic Policy Institute
From 1979–2007, incomes for the middle fifth of households grew, but the annualized rate of growth (0.6%) reflects a deep economic failure.
This middle-fifth growth lagged far behind average growth over the same period, and pales in comparison to growth during earlier periods of history; between 1947 and 1979, for example, cash incomes (not even including expanded employer-provided and government in-kind benefits like health care) for the middle fifth of American families grew at an average annual rate of 2.4%—or four times as fast as what was achieved by the middle fifth of households between 1979 and 2007.
If the middle fifth of the income distribution had grown at the average rate of income growth overall, these households would have had income $18,897 higher in 2007.
- 7%
The typical worker has not gained from improvements in the ability to produce more goods and services per hour worked (productivity growth). Between 1979 and 2011, productivity grew 69%, but median hourly compensation (wages and benefits) grew just 7%.
Policy choices generated inequality.
Policy decisions made over the last several decades have caused this explosive rise in inequality.
These decisions include: lowering individual and corporate tax rates; deregulating industries; failing to maintain the value of the minimum wage; failing to protect the right of workers to obtain collective bargaining; and failing to prevent asset bubbles.
- These sobering data could be mitigated by the ability of Americans to move freely up and down the income or wealth ladders (mobility). There is no evidence, however, that mobility has increased to offset rising inequality.
- Further examination of the data through the lenses of race and ethnicity finds the overall data obscure the dramatically worse outcomes minorities face.
- Gender gaps have been reduced in many of our labor market analyses. While due in large part to substantial gains for women, part of the closing of the gap has occurred because men have lost significant ground.
Get the data behind the charts.
Interactive feature: When income grows, who gains?
List your business in the premium web directory for free This website is listed under Human Resources Directory


