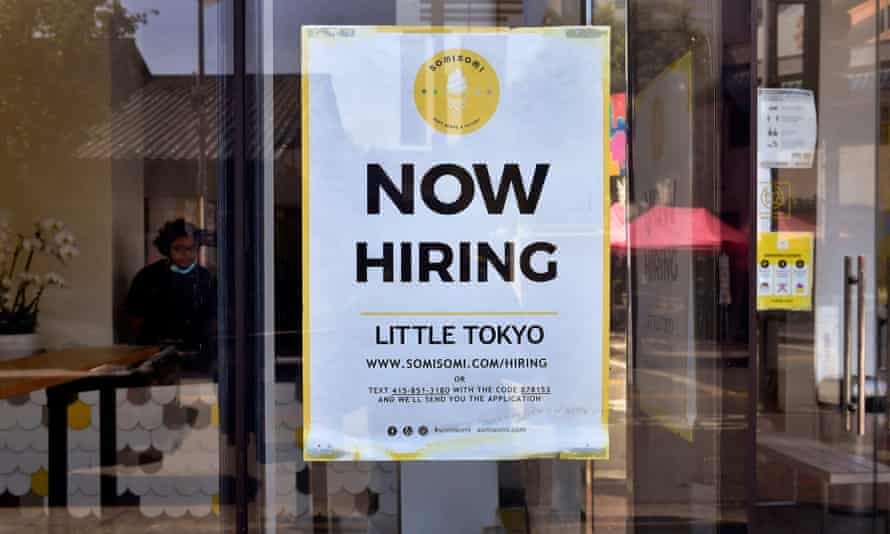
Just how healthy is the US jobs market? On Friday, the Bureau of Labor Statistics (BLS) released its latest jobs report, showing that the US added a disappointing 194,000 jobs last month while announcing that the official unemployment rate fell to 4.8%, the lowest it’s been since its frightening climb to 14.7% when the Covid-19 pandemic first struck the US.
The figures seem somehow disconnected and, for some, September’s headline figure is woefully misleading, as it is every month. What if the “true” unemployment rate is actually closer to 22%?
Overall unemployment rate
While most reporting (including our own) tends to focus on the BLS’s monthly headline figure – referred to as the “U-3” – the true measure of unemployment depends on who you ask. Some experts argue the official headline figure hides a far darker picture of the state of the labor market.
First, it is important to unpack what this commonly cited statistic does and does not tell us.
The headline unemployment rate measures the proportion of the American civilian labor force – anyone over the age of 16 – that does not have a job and is still actively looking for work. It does not include the large number of people who have given up looking for work, those stuck in low wage, low hour jobs or those stuck in part-time jobs when they want full time ones.
Economist Dr William Rodgers, vice-president and director of the Institute for Economic Equity at the Federal Reserve Bank of St Louis, sees the headline unemployment rate as more of a measure of the fluidity experienced by people trying to get job, rather than a definitive snapshot of who is not working.
Like Rodgers, researchers at the Ludwig Institute for Shared Economic Prosperity (LISEP) believe that this figure is probably a better measure of people who are unsuccessfully looking for work, rather than the true proportion of the American labor force that is unemployed, as it is sometimes interpreted. LISEP’s wider interpretation of what it means to be out of work pegged the unemployment rate at over 22% in August, more than four times the official benchmark rate.
Overall rate compared to alternate measures of unemployment
The official monthly report does also contain other measures of unemployment. The BLS’s uses another metric – known as the “U-6” – which not only considers the people out of work, but also those who are working part-time jobs when they want more, or have stopped looking for work though they would say yes if actually offered a job. That rate was 8.5% in September.
LISEP goes even further. Its true rate of unemployment (TRU) not only considers those who are discouraged or under employed, but also includes anyone who is making less than $20,000 a year.
Gene Ludwig, chair of LISEP, says it is essential to consider wages when we examine true unemployment because of what wages say about the ability of the economy to provide a decent living for its people.
“Numbers as high as we’re seeing ought to be deeply disturbing to any leader in the country, because it means we’re not, right now, a country that’s able to do this,” he said. “We’re not providing a decent life for our people.”
He is also careful to note that $20,000 is a very conservative cutoff that is based on the lowest living wage in all of the states. In many states, even those making higher amounts would not be close to a living wage, suggesting that the TRU rate may be an undercount as well.
Dr Rodgers also adds that because unemployment rates tend to consider only those who are in the labor force, other measures such as labor force participation rate – the percentage of people working or looking for work – or the employment population ratio – which measures the number of people currently employed as a share of the total working-age population – are critical for a fuller picture of the state of the economy.
The BLS’s headline figure also fails to give a full picture of the job market for historically disadvantaged groups. But the stark differences in employment for different racial groups are apparent to anyone willing to read further into the BLS’s monthly report.
Breakdown of participation rate by race and gender
These charts give a glimpse into those whose labor participation was most affected by the pandemic. For Black and Hispanic people, the drops in labor participation were more dramatic than that of their white counterparts – with notable gaps between their rates of participation during the pandemic and their pre-pandemic norms. Each drop not only represents those without a job, but more specifically, those who have had to drop out of the labor force entirely.
Structural barriers, such as the location of jobs, alignment of the skillsets of workers to available work, lack of childcare or even discriminatory practices, have influence on who participates in the labor force.
“I call it ‘the spigot effect’,” said Rodgers. “For certain groups, you have to take into account how much the faucet is turned on.”
When workers face enough barriers to drop out of the labor force entirely, they no longer appear in the headline unemployment rate at all.
Although 4.8% may sound like a job market in healthy recovery, the truth is that the pandemic is still being felt across the labor market and it is hurting those who can least afford it.